How to use the PYDPLANner
This document is work in progress and incomplete.
Modes and main features
PYDPLANner calculates the Buhlmann 16 tissue compartment decompression model throughout a configured or imported dive profile. The resulting model states throughout the entire dive profile can then be explored by using various graphical views to the data.
PYDPLANner can be used in 3 main modes:
- Calculation mode, where the user configures bottom depth, bottom time and gases to use, the application then calculates the Buhlmann model throughout the dive and produces a decompression schedule that does not violate Gradient Factor based ceiling.
- Custom mode, where the user can configure a custom dive profile and see the resulting Buhlmann model states.
Import mode, where the user can import a real dive profile from a dive computer or dive logging software and see the resulting Buhlmann model states.This mode is not yet implemented and is in the backlog of future development.
The main window
The application main window is divided into tabbed control panels on the left hand side, and tabbed viewer panels on the right hand side. On top there is a menu, which is still not doing much, but has planned future use.
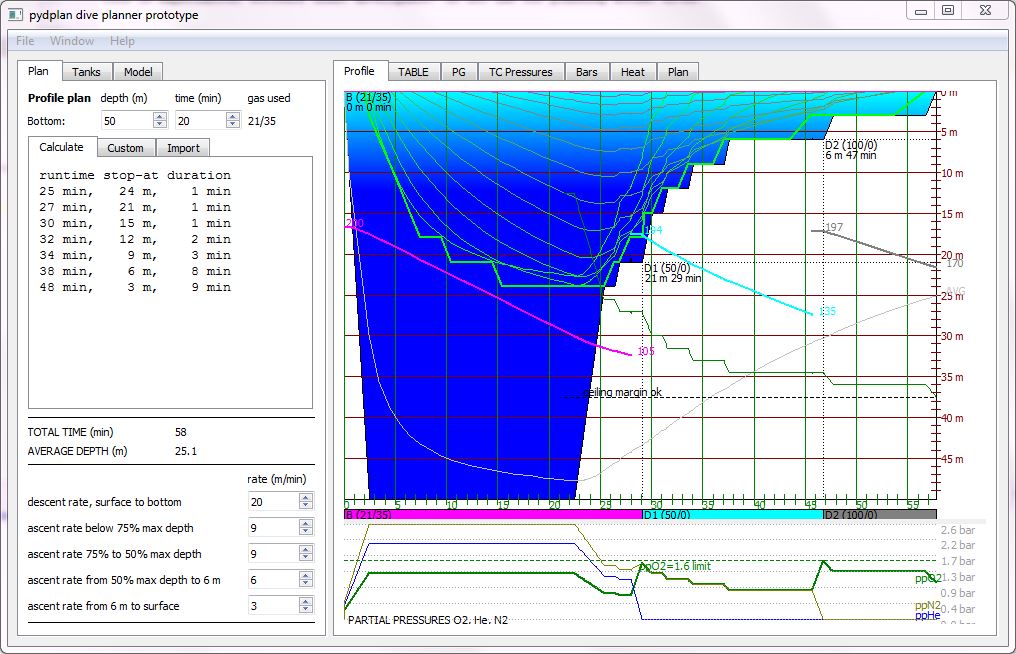
By default the application starts in Calculation mode in Plan tab selected on left side panel, and Profile view on the right hand side.
The main window has a minimum size, but by dragging edges or corners it can be resized to any size. It can be maximized and minimized or closed.
From menu File/Exit one can close the application. Or by CTRL-Q.
There is a slider widget between left and right side, which allows changing the proportion of side. But each side has a minimum widht and after pulling beyond that the entire panel goes hidden. The hidden panel can be dragged back from pulling the edge.
Control panels (left side)
By clicking a tab one can navigate to one of the following control panels:
- Plan allows selecting the operating mode and control the dive profile/plan
- Tanks allows selecting and configuring tanks and gases used on the dive
- Model allows controlling details of the decompression model
Plan
By clicking a tab one can select one of the following operating modes and related controls
Calculation mode
WARNING: DO NOT USE FOR REAL DIVE PLANS, THIS SOFTWARE IS NOT TESTED AND INCOMPLETE WORK IN PROGRESS
The user configures bottom depth, bottom time and gases to use, the application then calculates the Buhlmann model throughout the dive and produces a decompression schedule that does not violate Gradient Factor based ceiling.
Above the tabs there are two widgets that allow controlling the:
- Bottom depth in meters
- Bottom time in minutes
Changing any of these will immediately recalculate and redraw views. Feedback is immediate so one can easily see what changes take place when modifying parameters.
Under the Calculate tab there is a printout of calculated deco stops in tabular form. The profile can also be see graphically on the Profile view.
Below this the total runtime and average depth are shown. At the bottom one can configure the descent and ascent rates in m/min. Changing any of these will immediately recalculate and redraw views.
TODO:
There should be tickbox that allows selecting 3 meter stop on/off.
Custom mode,
The user can configure a custom dive profile and see the resulting Buhlmann model states.
Up to 9 deco stops by depth and time can be configured in this mode to create a custom profile. The user can then explore what such a profile looks in the Buhlmann model.
Import mode
This mode is not yet implemented and is in the backlog of future development.
The user can import a real dive profile from a dive computer or dive logging software and see the resulting Buhlmann model states.
Tanks
This panel allows selection and configuration of gases and tanks. Each tank is shown in one column, and on each row one can configure if the tank is used and what are tank and gas parameters.
Up to four tanks can be selected and configured to the dive:
- bottom tank is always in use, by default it is TMX 21/35 but can be changed to anything you want. Unless travel gas is selected, the bottom tank is used from surface to bottom until first deco tank. If no deco tanks selected then all the way back to surface.
- deco 1 tank is on by default and is EAN50 with gas change at 21 m
- deco 2 tank is on by default and is EAN100 with gas change at 6 m
- travel 1 tank is off by default. If enabled, it is used on decent until switch to bottom tank, and on ascent until gas switch.
Following tank parameters can be configured or viewed:
- used: yes/no (bottom gas is always used)
- O2%: Oxygen percentage of the gas
- He%: Helium percentage of the gas
- ppO2max: maximum ppO2 for the tank, used for MOD calculation
MOD: value calculated from ppO2maxnot implemented yetMin depth: value calculated from O2%not implemented yet- change gas depth (in meters): gas change will take place at this depth
- liters: volume of the tank, used in gas consumption calculations
- start (bar): starting pressure of the tank when taken into use on dive
- SAC (L/MIN): Surface Air consumption
- end (bar): calculated end pressure of the tank for the configured profile
TODO:
Warnings etc..
Model
Allows controlling details of the decompression model.
- Buhlmann model: a, b, c
- Gradient factor low and high in %
At this time model selection actually does nothing and model C is always selected. The difference between models are:
- A was the original theoretical model using calculated coefficients, but proved to be not conservative enough
- B is the improved model with adjusted coefficients based on experiments and research on real dives. B model was intended to be used for calculating tables.
- C is intended to be used with dive computers doing real time calculation
Gradient Factors
Using Gradient Factors adds conservatism to the model. The original Buhlmann model would be setting Gradient Factors to 100/100.
Here are some articles about Gradient Factors:
The Gradient Factor LOW sets the deco ceiling on ascent until the first deco stop is reached. After this the Gradient Factor is increased linearily such that on surface the deco ceiling is calculated using Gradient Factor HIGH.
Simply put, the lower you set GF LOW, the deeper you will get deco stops. A higher GF LOW will not produce deep stops. The lower you set GF HIGH, the longer decos you will get at 6 to 3 meters.
Common Gradient Factor settings (LOW/HIGH) are:
- 100/100 the original Buhlmann model. Not recommended for actual use.
- 20/85 GUE recommendation
- 30/85 default in Shearwater dive computers in OC TEC mode
- 35/75 Shearwater dive computers in OC REC mode, high conservatism
- 40/85 Shearwater dive computers in OC REC mode, medium conservatism
- 45/95 Shearwater dive computers in OC REC mode, low conservatism
Viewer panels (right side)
On the right side one can select a tab to view any of the following views to the data.
- Profile
- TABLE
- PG
- TC Pressures
- Bars
- Heat
- Plan
Profile
This view shows:
- on the top side the dive profile
- below the profile the tanks/gases used
- on bottom the partial pressures of each gas
dive profile
The dive profile is plotted in filled blue with runtime in minutes on x-axis starting from left. Depth is on y-axis with depth growing downwards to bottom.
The thick green line is the calculated deco ceiling in 3 meter steps. Above it one can see the unrounded deco ceilings from all tissue compartments in different shades of green. The deco ceiling shown takes gradient factors into account.
The tank pressures are also plotted with gas changes, star end end pressures of tanks.
The running average depth is plotted in grey.
On right bottom quadrant the ceiling margin is plotted.
- When the margin is positive, which means dive profile does not violate the deco ceiling, you will see a solid black jagged line and the text “ceiling margin ok”
- When there is ceiling violation, the violating parts are shown in thick red line, and there will be text “ceiling margin ERROR!” in red. This means the dive profile is not safe.
partial pressures panel
Plot of Oxygen, Nitrogen and Helium partial pressures at this profile. Oxygen and Nitrogen limit lines are shown:
- 1.6 ATA for Oxygen is generally the limit for deco gases, for bottom gases 1.4 is common
- 3.16 ATA for Nitrogen is equivalent to 30 meters using air (21% O2)
- limit for Helium is not shown here, but 6 ATA could be shown for HPNS limit
TABLE
This panel shows numerical data of the dive profile in a table. Each point in the dive profile is on a single row, whereas columns show data of that point. If you hover the cursor over a column heading, then you will see a longer explanation of the column data.
The columns are
- ‘time’, ‘runtime in min:sec’
- ‘depth’, ‘current dive depth in meters’
- ‘phase’,’current dive phase’
- ‘T’, ‘currently used scuba tank ID’
- ‘o2/he’, ‘Oxygen/Helium % in current tank’
- ‘he’, ‘Helium % in current tank’
- ‘bar’, ‘Tank pressure in bar’
- ‘ppO2’, ‘Oxygen partial pressure in bar’
- ‘GF’, ‘Gradient Factor used’
- ‘C:3m’, ‘GF Ceiling depth at 3m increment’
- ‘CEIL’, ‘GF Ceiling depth in meters, no rounding’
- ‘margin’, ‘Ceiling margin, meters from current depth’
- ‘lead’, ‘leading/ceiling tissue compartment number’
Following columns show the ceiling in meters for each tissue compartment number ffrom 1 to 16.
PG
This panel shows a Tissue Compartment pressure graph, where X-axis presents the Tissue Compartment pressure vs. Ambient Pressure (Depth) on Y-axis.
Diagonal lines plot the M-values of each tissue. Each tissue is shown in different color.
3 plots are available:
- Combined, Heium + Nitrogen pressures
- Helium only
- Nitrogen only
TODO: The M-value lines are not plotted correctly yet. Needs fixing.
TC Pressures
This panel plots the pressure on individual Tissue Compartments for Helium and Nitrogen separately.
The depth profile can be seen in the background.
Bars
This panel shows the tissue compartment pressures at a selected run time of the dive. You use the slider at the top to select the run time. The respective tissue compartment pressure is shown in bars growing downwards. The green part of the bar is Nitrogen pressure, the blue part is Helium. However, when the model ceiling is being violated, the bars change color.
The horizontal black line is the ambient pressure.
When the tissue pressure bars are growing, it means the tissue is on-gassing, which happens at decent and bottom. When the pressure bars are shrinking - at ascent - the tissue is off-gassing.
Below each bar there are lines that represent:
- brown line is the Buhlmann maximum tolerated ambient pressure for that tissue compartment. If the tissue compartment exceeds this, then according to the theory there is a significant risk of dangerous bubble formation and therefore DCS. This line turns to thick red when the model violation occurs.
- green line is the gradient factor adjusted maximum tolerated ambient pressure. This also turns to thick red when the model violation occurs.
- two back lines are the GF low and GH high limits
- the percentage below the bars is the tissue pressure vs ambinet pressure, such that 100% equals ambient
Heat
This panel shows the heat map of tissue compartments, where the color tells is the compartment if on or off gassing and by how much.
The control of the colors is not quite yet what it should be, so this feature needs a little polishing.
- The x-axis of the heat map represents the run time starting from left
- the y-axis contains each of the tissue compartments
- shades of blue means the compartment is on-gassing, the darket the blue gets, the more saturated the tissue is
- shades of green means the compartment is off-gassing within safe limits, the lighter the green, the safer the off-gassing is
- when the color turns to yellow, the safe limit is approaching, and red means danger, the brighter the red, the more dangerous the situation is
Plan
This panel is not yet implemented and is in the backlog of future development. The intention is to print a dive plan here with all the details.